April 22, 2025
By Roland Calia
Introduction
State debt burden—a state’s total financial liability from various forms of borrowing, including bonds, loans, and related financing instruments—is one of the core indicators of a government’s fiscal health, stability, and creditworthiness. This Civic Federation analysis indicates that, based on current State projections at the time of publication, the State of Illinois is positioned to continue a nearly decade-long trend of gradually reducing its debt burden. That situation could change, however, with economic disruptions or future fiscal shortfalls.
Over the past ten years, the State of Illinois has reduced its total amount of outstanding debt by 13.5%, or $5.9 billion, from $44.0 billion to $38.1 billion. Governor Pritzker’s FY2026 budget proposal projects a year-over-year reduction in debt from the prior year of approximately $200 million, or 0.5%.
Much of the decrease over the past decade is due to a dedicated effort to accelerate paying down two types of debt incurred through prior gubernatorial administrations. The first type is bonds sold to fund pension payments in 2003 during the Blagojevich Administration. The second is general obligation debt incurred to pay off the State’s backlog of payments owed to vendors and service providers (referred to in finance terms as accounts payable, but known informally as the state’s “bill backlog”). This bill backlog peaked at nearly $17 billion due to the two-year state budget impasse in FY2016 and FY2017 during the Rauner Administration. Outstanding bill backlog debt declined from $7.9 billion in FY2018 to a projected $2.8 billion in FY2026.
Governor Pritzker’s Administration has prioritized paying down Illinois’ debt as part of efforts to stabilize the State’s finances. Despite a slight increase in general obligation bond debt per capita—amplified during the COVID-19 pandemic—the State's bond ratings remain investment grade, reflecting a stable outlook for managing interest costs.
Understanding Illinois' Debt
The State of Illinois currently has four main types of long-term debt:
- General Obligation (GO) bonds for capital projects.
- GO bonds to pay pension obligations.
- GO bonds to pay backlogged bills.
- Build Illinois Revenue Bonds.
The long-term liability for these bonds includes the principal amounts initially borrowed plus interest costs that must be paid back over time. The payments owed are referred to as debt service obligations.
Illinois issues general obligation and revenue debt to fund its capital plan. The capital plan provides legal authorization for both current and future spending for infrastructure, including roads, mass transit, facilities, and water and sewer improvements. The amount varies from year to year as new debt is authorized and some debt is retired. In 2019, the General Assembly approved, and Governor Pritzker signed into law, a $45 billion multi-year capital plan called Rebuild Illinois. This was the first state capital plan since the Illinois Jobs Now! capital plan in 2010 under the administration of Governor Pat Quinn. The FY2026 Illinois capital budget proposes appropriations of approximately $44.4 billion; this includes new spending and reappropriation authority.
It is important to note that long-term unfunded pension liabilities are not included in state debt estimates. Public discussion often conflates long-term debt and unfunded pension obligations. The unfunded pension liabilities, often referred to informally as “pension debt,” were recently estimated by the Illinois Commission on Government Forecasting and Accountability to be approximately $143.7 billion. Pension obligations are not constituted of borrowing or financing, but rather are actuarially estimated payments that the State is obligated by law to pay in the future. These obligations are not part of what is meant by debt burden and, therefore, not part of this analysis.1
General Obligation Bonds
General Obligation (GO) bonds are guaranteed by a pledge of the full faith and credit of the State and are typically used to fund capital and infrastructure projects authorized annually in the State’s capital budget. GO Bonds are a legally binding commitment for the government to pay back both principal and interest on these loans to investors, as required by the bond agreements, prior to directing revenues to any other use of State funds. The State is authorized under the General Obligation Bond Act to issue bonds to fund a variety of capital investments, including roads, schools, mass transit, environmental projects, and other facilities.
The State of Illinois pays debt service on General Obligation bonds primarily with revenues from the general funds, including income and sales taxes. Bonds issued for specific purposes are paid for with resources from the Road Fund (which receives revenue primarily from motor fuel taxes, motor vehicle registration fees, and a portion of the sales tax on motor fuel), the Capital Projects Fund (which receives revenue from a broad range of sources), the School Infrastructure Fund (primarily funded with transfers from the General Fund), and other related state funds.
GO bonds are the primary funding source for the State’s long-term capital plan (and capital budgets, which are the annual components of the capital plan updated each year). The capital plan provides legal authorization for both current and future spending. The amount varies from year to year as new debt is authorized and some debt is retired. The most recent long-term capital plan, Rebuild Illinois, was enacted in 2019. This $45 billion multi-year capital plan was the first state capital plan since the Illinois Jobs Now! capital plan established in 2010. In line with Rebuild Illinois, the FY2026 Illinois capital budget proposes appropriations of approximately $44.4 billion, including both new spending and reappropriation authority.
Pension Obligation and Pension Acceleration Bonds
In 2003, the Illinois General Assembly amended the General Obligation Bond Act to include the authorization to issue $10 billion in Pension Obligation bonds (POBs) to help reduce the State’s long-term pension liabilities. These bonds were sold to increase the assets in the State’s pension funds and make the required annual contributions to Illinois’ five retirement systems. The State issued additional POBs in FY2010 and FY2011; each of these was retired in 2015 and 2019, respectively. There is no ongoing statutory authority to issue additional POBs at the time of publication.
In 2018, the General Assembly authorized the issuance of up to $1 billion in Pension Acceleration bonds to reduce pension liabilities. In May 2022, the State increased the authorization for these bonds to $2 billion. Pension acceleration bonds are intended to finance the cost of two programs:
- A program to provide a one-time, lump sum pension benefit payment equal to 60% of the actuarial present value of future pension benefits to former State employees who have not yet received a pension.
- A program to provide a one-time, lump sum pension benefit payment to Tier 1 retirees if they agree to receive pension annuities with a reduced 1.5% non-compounded Annual Automatic Increase (AAI) instead of the standard 3% compounded Tier 1 AAI.
Backlog Bill Bonds
In 2017, the General Assembly approved legislation authorizing the issuance of $6 billion in bonds to pay down the State’s unpaid bill backlog. These are called Section 7.6 bonds. In November 2017, the State issued the bonds at an interest rate of 3.5%. The bonds will mature in November 2029. Bill backlog debt declined from $7.9 billion in FY2018 to a projected $2.8 billion in FY2026,
Public Act 101-0300 amended Section 7.6 in June 2019 to authorize the issuance of an additional $1.2 billion in backlog bonds. Given the reduction in unpaid bills, the State does not plan to issue any of these bonds at this time. As of the FY2024 budget, the State has been on a normal bill payment cycle.
Build Illinois Revenue Bonds
Illinois also uses several types of revenue bonds to fund capital projects. Unlike GO bonds, revenue bonds are not guaranteed by the full faith and credit of the State, but rather, they pledge a portion of specific State revenues. The largest ongoing revenue bond issuances are the Build Illinois Bonds, which were first issued in 1985. Build Illinois Bonds are backed by a pledge of the State’s portion of sales tax receipts and by various other revenue sources that fund the Capital Projects Fund.
Key Indicators of Debt Burden
This analysis examines trends in three commonly used financial indicators of debt burden:
- Debt outstanding;
- Debt per capita; and
- The ratio of debt service expenditures as a percentage of the government’s total expenditures.
Monitoring government debt supports informed decision-making, sustainable fiscal policies, and balanced investments in essential services. Tracking these debt burden indicators over time is important for understanding the following factors:
- Risk and Stability: Monitoring debt levels can help identify future challenges in meeting payment obligations.
- Fiscal Responsibility: Understanding debt levels guides policymakers as they make budgeting decisions and sustainable borrowing policies.
- Creditworthiness and Costs: Debt levels influence a state's credit ratings, with lower debt generally leading to better borrowing terms.
- Economic Stability: Debt per capita (per person) and debt service ratios reveal how well taxpayer resources are managed.
- Transparency and Accountability: Regular tracking of debt levels promotes transparency and allows stakeholders to understand how public funds are spent and prioritized.
Increases in debt burden indicators can signal escalating financial risk. A rising debt burden raises the concern that unless a government secures additional revenues or reduces spending, it may have difficulty making principal and interest payments on debt at some point in the future. Rising debt, and therefore the repayment of that debt, also means that less funding is available for other public priorities and services.
Trends in Total Debt Outstanding
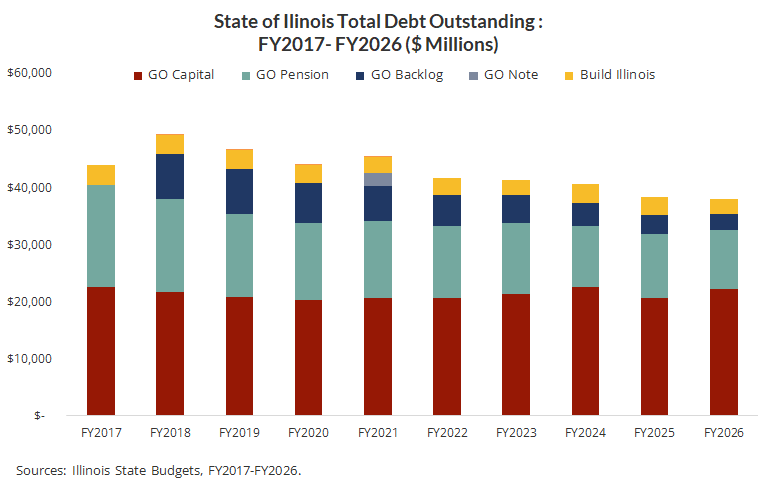
The following chart shows the total amount of debt outstanding for general obligation and revenue debt between FY2017 and FY2026. These figures include both principal and interest obligations.
Since FY2017, Illinois’ total outstanding debt has fallen by 13.5%, decreasing from $44 billion in FY2017 to $38.1 billion in FY2026. More specifically:
- General obligation debt to fund capital projects declined from $22.7 billion in FY2017 to a projected $22.2 billion in FY2026, a 1.9% decrease.
- Pension debt declined from $17.9 billion in FY2017 to a projected $10.3 billion in FY2026, a 42.2% decrease.
- Bill backlog debt declined from $7.9 billion in FY2018 to a projected $2.8 billion in FY2026, a 64.6% decrease, as most of those bonds were paid off. Bill backlog debt was a significant component of overall debt outstanding between FY2018 and FY2024 before it began to decline.
- General obligation notes debt of $2.2 billion issued in FY2021 during the COVID-19 pandemic were retired in 2022. These funds were used to repay funds borrowed from the federal Municipal Liquidity Fund.
- Build Illinois revenue debt declined from $3.5 billion in FY2017 to $2.7 billion in FY2026, a 21.7% decrease. During this period, revenue debt service averaged 7.2% of all debt issued.
Between FY2025 and FY2026, total outstanding GO and revenue debt outstanding is projected to decline slightly by 0.5%, falling by $199.7 million from $38.3 billion to $38.1 billion. GO capital debt outstanding will increase by $1.5 billion, rising from $20.7 billion to $22.2 billion. However, between FY2025 and FY2026:
- GO pension debt outstanding will decline by $758 million, falling from $11.1 billion to $10.3 billion;
- GO bill backlog debt outstanding will decrease from $636.7 million, declining from $3.4 billion to $2.8 billion; and
- Build Illinois revenue debt outstanding will fall by $308.0 million, decreasing to $2.7 billion from $3.0 billion.
Debt Outstanding per Capita
A commonly used measure of the debt burden on residents and taxpayers is general obligation debt outstanding per capita (per person). This indicator divides the amount of general obligation debt paid for from general revenues outstanding by the total population of the jurisdiction. It includes all state debt that has a full faith and credit security pledge; this is the vast majority of debt issued by Illinois. It excludes revenue debt paid for with dedicated revenues that include user fees.
This indicator is often used as a comparative measure of debt burden across jurisdictions. It is important to watch increases over time in the debt per capita ratio, because, like the total outstanding debt numbers, it is a potential sign of increasing financial risk. A modest per capita debt burden suggests that there is taxpayer capacity to draw on. In plain terms, general obligation debt per capita shows how much of the State’s primary debt each resident is effectively responsible for, helping us track whether the overall debt burden is growing or staying manageable.
The following chart shows general obligation (GO) debt per capita for the ten years between FY2017 and FY2026. In this period, the State's total GO debt per capita increased by 8.7%, from $1,925 to $2,093. Debt per capita rose to $2,456 during the COVID-19 pandemic when the State borrowed funds from the Federal Reserve Bank’s Municipal Liquidity Fund.

Debt Service Ratio to State Expenditures
The ratio of debt service expenditures to total Governmental Fund or operating expenditures is frequently used by rating agencies to assess a government’s debt burden. When debt service payments reach 15-20% or more of all appropriations, it is generally viewed as high by the rating agencies. This metric provides a useful “apples to apples” comparison of relative fiscal burden across governments.
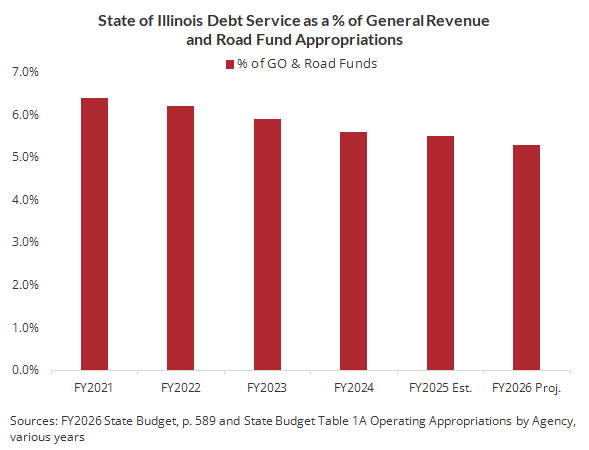
The following chart shows State General Obligation debt service as a percentage of General Fund and Road Fund expenditures. Long-term general obligation debt, including capital improvement bonds, pension obligation and acceleration bonds, and bill backlog bonds, is paid for with revenues from the General and Road Funds. The debt service ratio for this indicator has declined from 6.4% to 5.3% of these funds since FY2021. The ratio has averaged 5.8% over the five-year period.
The State of Illinois’ debt service ratio is low, well below the 15% to 20% metric that would trigger concern from the rating agencies. This is a positive indicator.
State Transfers of Debt Service
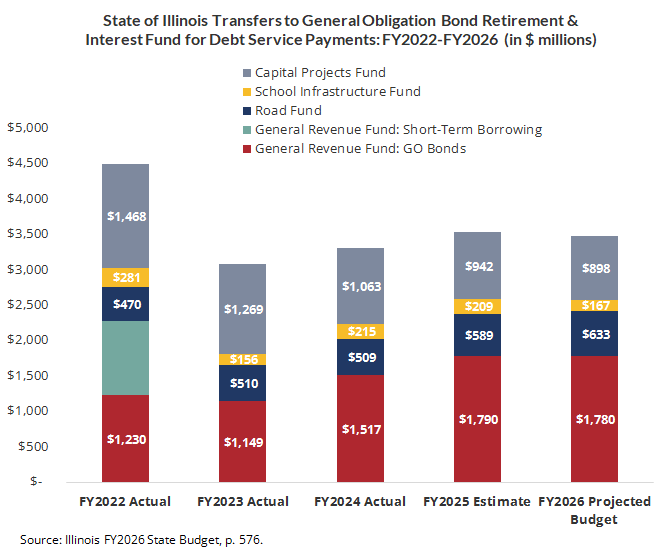
State debt service for principal and interest costs is paid for from two sources: 1) annual appropriations from the General Obligation Bond Retirement and Interest Fund (GOBRI); and 2) advance set-asides transferred from other state funds. Therefore, each year, a portion of the State’s total debt service repayment is made through a transfer from the General Revenue Fund to GOBRI. Additional transfers are made from the Road Fund, School Infrastructure Fund, and Capital Projects Fund. Debt service for Build Illinois Bonds is paid through sales taxes that are diverted outside the General Funds and through the Capital Projects Fund. Other state funds are used to pay for the remaining debt obligations.
In FY2026, the total debt service transfer to GOBRI will total nearly $3.5 billion, a decrease of $52.0 million from the previous year. Between FY2022 and FY2026, debt service transfers will fall by $1 billion, due primarily to the retirement of a number of School Infrastructure and Capital Projects bonds. However, General Revenue GO bond transfers will increase between FY2022 and FY2026 by $550 million, rising from $$1.2 billion to $1.8 billion.
The following chart shows the transfers to the General Obligation Bond Retirement and Interest Fund for FY2022 through FY2026.
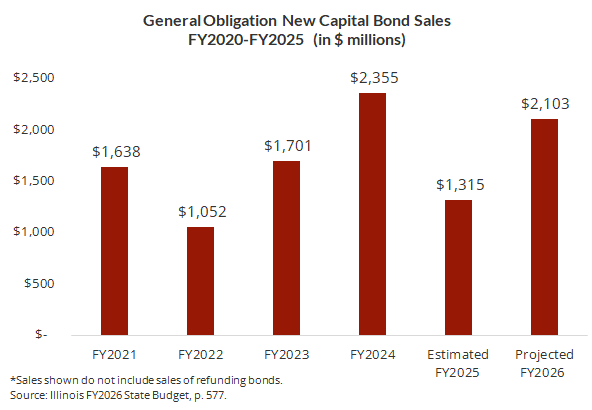
New General Obligation Debt Issuances (FY2025-FY2026)
The Governor’s proposed FY2026 Budget Book announced that the State plans to issue nearly $2.1 billion in new GO bonds to fund capital projects. This is an increase from the $1.3 billion issued in the 2025 fiscal year. The new bond issues will be used to finance a number of capital projects that have progressed from the planning and design stages to the construction phase. The bond issues over the five years from FY2022 through FY2026 support projects in the State’s Rebuild Illinois capital plan approved in June 2019.
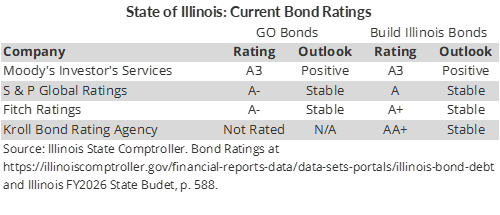
Illinois Bond Ratings
Bond ratings are one of the factors that weigh heavily in determining the interest rates the State must pay to issue debt. The following chart shows the current ratings for Illinois’ General Obligation Bonds and Build Illinois Bonds. The current State of Illinois ratings are all investment grade.
In recent years, the State has received a number of credit upgrades as its financial situation has improved. In 2023, Fitch Ratings, Moody’s Investors Services, and Standard and Poor’s all upgraded the State of Illinois' general obligation bond ratings. They cited the State’s increased reserves, the significant paydown of outstanding accounts payable, and increased sales tax collections as the reasons for the upgrades. The rating agencies, however, continued to warn that the State still faces large long-term liability pressures, particularly from pensions, that constrain its fiscal flexibility.
References
1 A summary of the state’s current pension obligations is discussed in the Civic Federation’s FY2026 State Budget Roadmap.